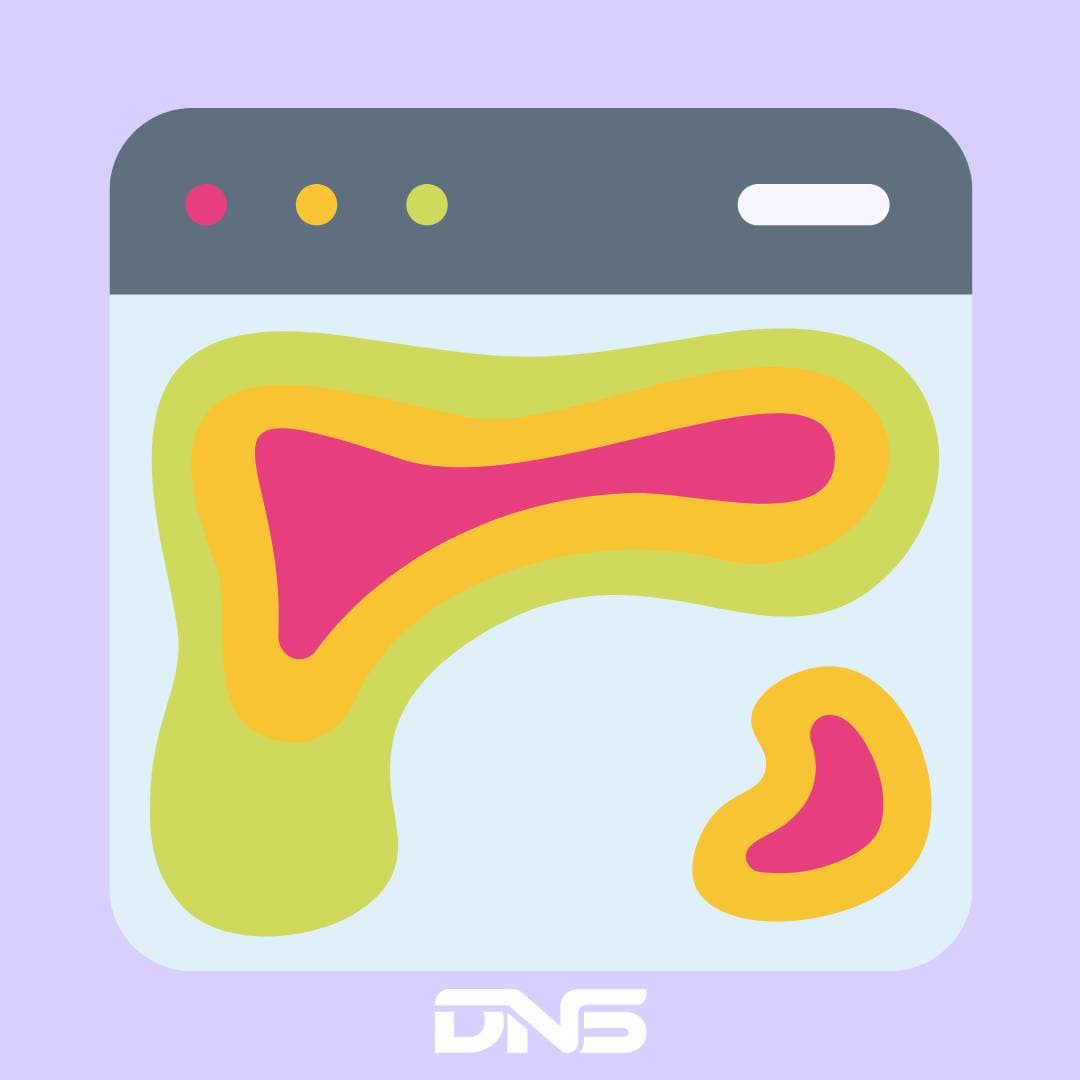
How To Use Heatmaps To Improve UI/UX
Heatmaps: A Key Visualizer for your Website
Have you been trying to better understand your customers’ and audiences behaviour on your website? If so, heatmaps might be the ultimate solution to improving the UI and UX of your website! Heatmaps provide a easy to understand, visual display of data which highlights your users’ behaviour patterns, interactions and engagement on a website. Heatmaps help you identify trends, give you insights on your users’ journeys and allows you to drastically improve the user experiences.
How Heatmaps Skyrocket Your Conversion Rates
Imagine if you could read a website visitor’s mind and see which designs, content or website element is more useful to them. Being able to see what they look at and what they never see will help you optimize how website layout so that you can drastically improve conversion rates. Heatmaps allow you to visually see this so that you can make smarter critical site improvements that improves conversions and engagement. With these analytical tools, you can visualize data in real time for better optimization of your user experience.
Top Reasons to Integrate Heatmaps into Your Website
Heatmaps are Analytics Powerhouses
Heatmaps are beneficial for several reasons:
- They reveal
actionable insightsthat can help you identify which parts of your site need attention, thereby guiding your design and development decisions. Instantly. - They are
easy to usewith a user-friendly interface and powerful visualization techniques. - They cause minimal load on your website since they have a
relatively small footprint. - They are
affordable, offering a high ROI considering the breadth of data they collect and analyze.
How a Heatmap Enhances Your UI/UX
Heatmaps are incredible for redesigning and improving user experience. They help identify which sections of a site attract the most attention and the least, helping you optimize your website design, improve navigation, and increase overall user engagement.
Decoding Heatmaps: A Guide to the Different Types and Their Uses
Scroll Heatmap
Scroll heatmaps show which user-viewed percentage of users are reaching different parts of your page, revealing ‘dead zones’ and highly-engaging sections.
Click Heatmap
Click heatmaps depict areas with most and least clicks. They’re useful when it comes to optimizing button placement, CTAs, and other interactive elements throughout your website.
Attention Heatmap (Mouse Movement)
Attention heatmaps show you where users concentrate the most time, enabling you to understand if your key messaging and visuals are compelling to your audience.
Tools of The Trade: Creating Heatmaps with These Efficient Tools
Want to use heatmapping analytics tools but don’t know where to start? Let us make it easier for you. There are numerous heatmapping tools, each with their unique features. The major ones are:
- Clarity: Provides deep insights about how users are interacting with a site. It’s also free to use and really easy to integrate with your website.
- Mouseflow: Offers six different types of heatmaps with a handy visual editor.
- Hotjar: Known for its robust features and user-friendly interface.
- Crazy Egg: A popular choice due to its snapshot feature.
Once you set this up, it’s pretty easy to get started on your journey of visual analysis of your website. Using these insights, you or your digital marketing partner can make quick decisions to improve the website experience for your visitors.
Elevate your UI/UX with Our Design & Development Services
Want to leverage the power of heatmaps to elevate your site’s UI/UX? We specialize in UI/UX Design to enhance user experience and boost conversion rates on your websites and apps. We’ll help you create a site that’s not only visually appealing but also user-friendly and efficient. Get in touch to learn more about our Ottawa web design & development services!